Animator by Squillion
Elevate your reports with dynamic, engaging visuals that uncover insights and start conversations!
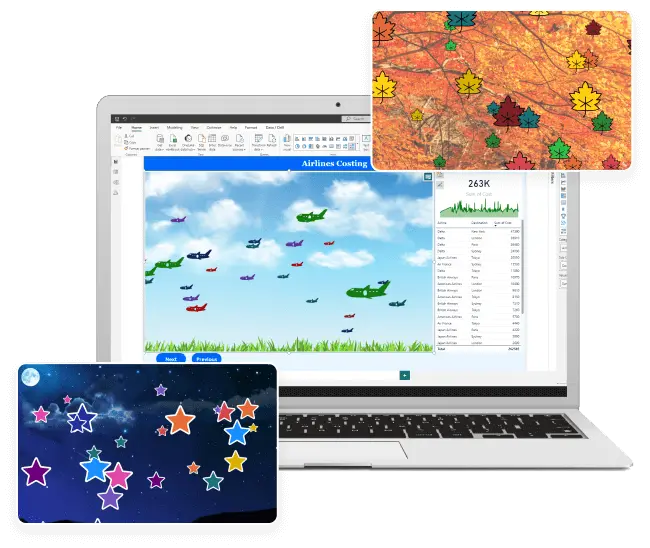
Transform Your Data into Living Stories with Animator by Squillion! Animator by Squillion could be your gateway to a variety of themes, icons, and customizable features. With easy-to-use features, Animator by Squillion helps you create eye-catching visuals that uncover insights and start conversations. Whether you’re presenting sales trends, marketing data, or operational metrics, Animator by Squillion adds more depth to your analysis.
Trusted by well-known Clients

























Avg. Monthly Downloads
0
+
License Users
0
+
Top Rank by Popularity
0
features List

Engaging Animation
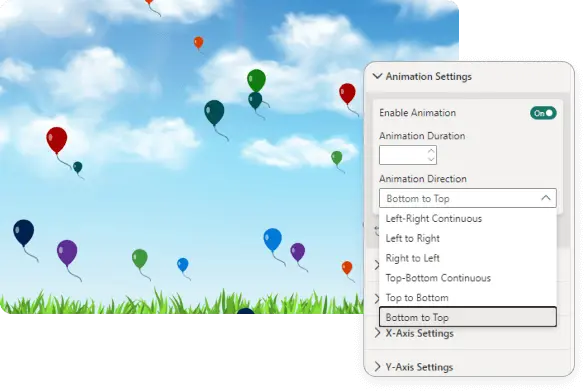
Add life to your visuals with captivating animations. Choose from six different animation directions, including left-right continuous, up-down continuous, and more. Set fixed durations to control the speed of animations for optimal storytelling.

Engaging Animation
Add life to your visuals with captivating animations. Choose from six different animation directions, including left-right continuous, up-down continuous, and more. Set fixed durations to control the speed of animations for optimal storytelling.
Dynamic Visual Icons
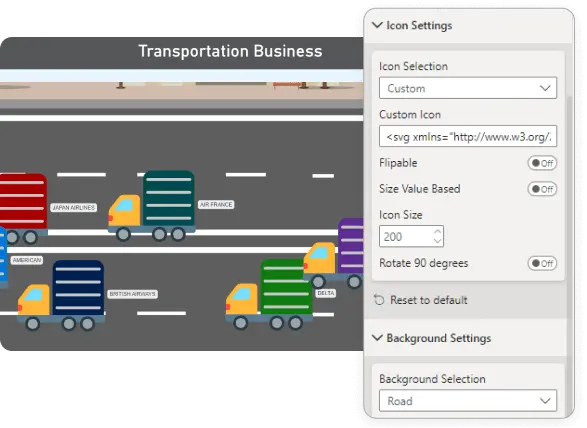
Choose from a variety of icons such as car, plane, boat, star, arrow, and more. Easily customize their size and rotation for added visual appeal. With the professional version, unlock the ability to add your own custom icons, allowing for endless possibilities.Background Personalization
Select backgrounds that complement your icons and enhance the overall theme of your report. Adjust top and bottom buffers to ensure your icons fit perfectly within the chosen background. Professional version users can even use transparent custom backgrounds for a unique visual experience.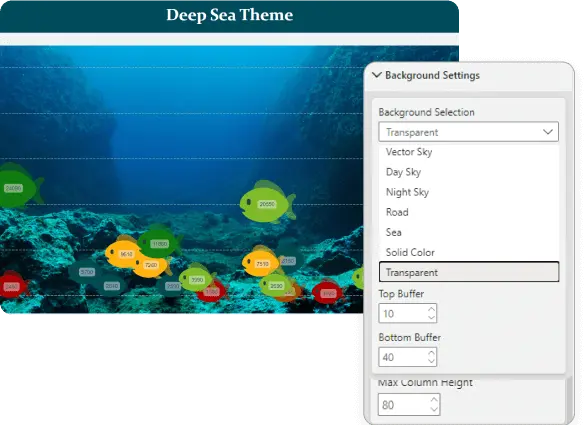

Background Personalization
Select backgrounds that complement your icons and enhance the overall theme of your report. Adjust top and bottom buffers to ensure your icons fit perfectly within the chosen background. Professional version users can even use transparent custom backgrounds for a unique visual experience.Video demonstration

Why Choose Animator By Squillion?


Microsoft Power BI Certified
Rest assured, Animator by Squillion meets the highest standards of quality, compatibility, and performance.

Customization Flexibility
Dive into a variety of fill options, formatting choices, and category support to create visuals that perfectly reflect your data's story.

Enhanced Data Presentation
Transform your data into captivating visuals with advanced Punchcard features that engage and inform your audience.

Empower Decision-Making
Drive action and prompt discussions with visually appealing and insightful reports.

Faster Response Time
Experience a smooth and efficient user interface with optimized performance for real-time analysis.

Regular Updates
Benefit from consistent updates that improve performance, introduce cutting-edge features, and ensure compatibility with the latest Power BI advancements.
Visual Plans

| Plan | Monthly Price | Annual Price |
|---|---|---|
| Animator by Squillion (1-10 Users) | First month free, then $0.70/user/month |
First month free, then $7.00/user/year |
| Animator by Squillion (11-150 Users) | First month free, then $0.35/user/month |
First month free, then $3.50/user/year |
| Animator by Squillion (151-1000 Users) | First month free, then $0.07/user/month |
First month free, then $0.70/user/year |
| Animator by Squillion (1001-2500 Users) | First month free, then $0.035/user/month |
First month free, then $0.35/user/year |
| Animator by Squillion (>2500 Users) | First month free, then $0.028/user/month |
First month free, then $0.28/user/year |
Custom pricing available for enterprises with specific needs. Contact us for details.
Get started with Animator by Squillion today!
Add and Explore Animator by Squillion’s set of features. Make your report visually rich.- Themed Visual
- Dynamic Icons
- Supportive Backgrounds
- 6 Different Animations
- Customizable Labels & Axis
FREE

Premium Features for an Enhanced Experience!
Unlock the full potential of your data with Premium version of Animator by Squillion. Elevate your reports, captivate your audience & unlock insights that drive success.- Watermark Removal
- Custom SVG Icons
- Custom (transparent) Background
- Precise Coloring
PREMIUM

FAQs
Will purchasing one of the plans remove the watermark?
Yes, purchasing any of the plans will remove the watermark.
Does your visual require separate licensing for each viewer?
Yes, there will be separate licensing per user. If you have a greater number of viewers, we recommend you select a plan according to your user base. We also support enterprises, so feel free to contact us directly for a custom quote.
I can use all the features in desktop version while report development but as soon as I publish it asks for license. Is your visual fully licensed?
No, only a few features require a license. So, if you are using any of those features, the visual will ask for a license. Here’s the list of features you unlock with a license:
1. Custom Icon
2. Transparent Background
3. Category Icons
4. Watermark
The Icons are going out of the boundary based on the background image, what should I do to fix it?
There is an option of setting Top Buffer & Bottom Buffer in Background card of formatting settings. You can also check the sample .PBIX file where you can explore all the features related to the visual.
How do I display Icons positioned based on value?
There is an option of setting Icon X Position & Icon Y Position in Data Point card of formatting settings. You can also check the sample .PBIX file where you can explore all the features related to the visual.
I’m finding animation inappropriate in my case, can I turn it off?
Yes, certainly. You can disable the toggle on the Animation card of formatting settings to turn off the animation.
Is there a way to show axis?
Yes, you can explore X Axis and Y Axis card available in the visual formatting and explore different features related to axis.
