Blogs
Check out the latest topics & trends
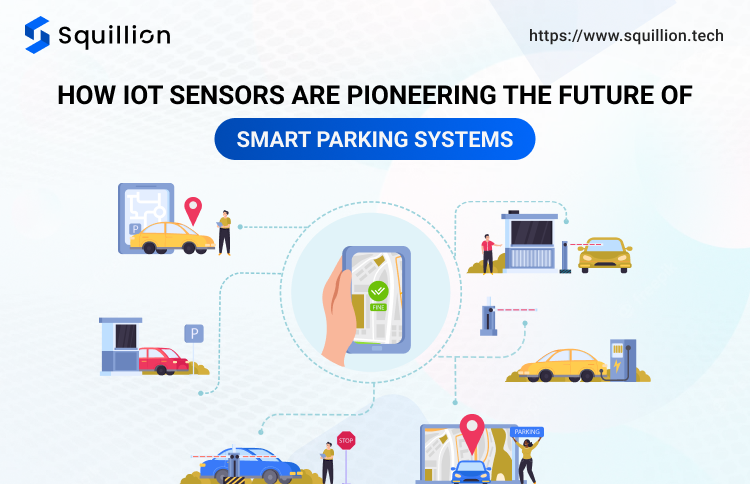
Take the example of San Francisco's SFpark project. This initiative, harnessing the power of IoT, adjusted parking prices based on real-time demand. The result? A dramatic 50% reduction in the time drivers spent searching for parking.
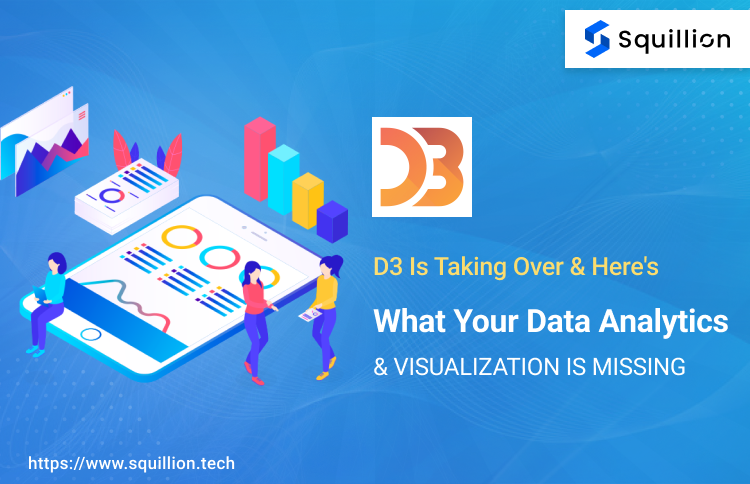
In the vast ocean of data visualization tools, D3.js, commonly referred to as D3 stands out as a beacon of innovation. D3, which stands for Data-Driven Documents, is a cutting-edge JavaScript library designed to bring data to life using HTML, SVG, and CSS.
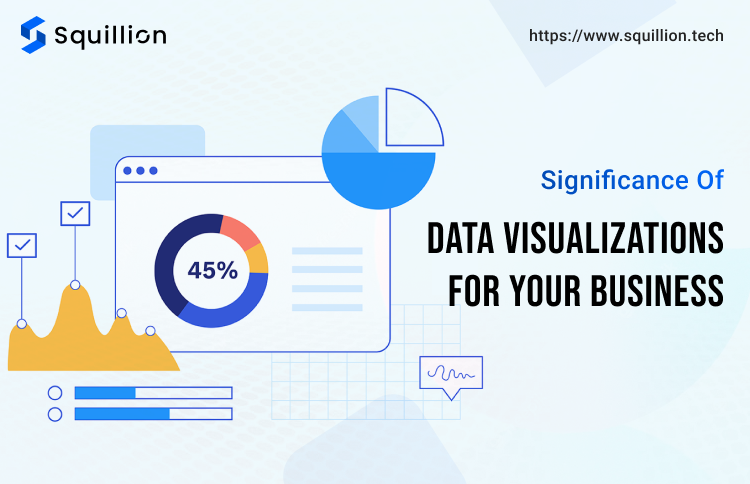
Data visualization isn't just about creating charts or graphs; it's about presenting data in a way that's intuitive and actionable. With the sheer volume of data businesses handle daily, quick and clear interpretation is crucial.
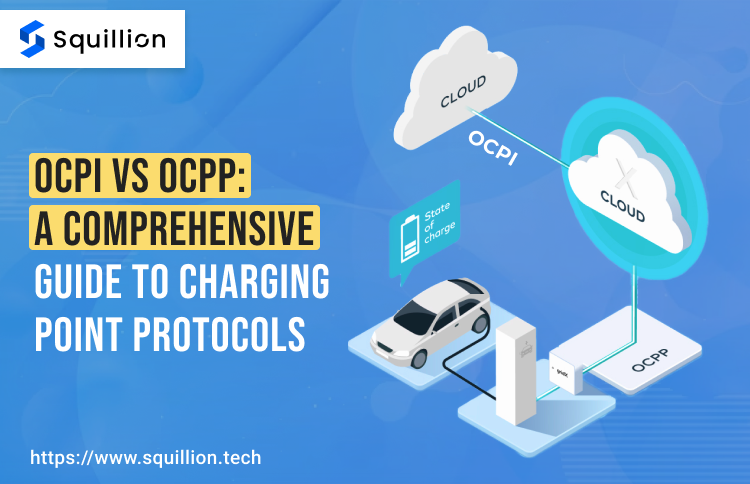
The Open Charge Point Protocol (OCPP) is a globally recognized standard that facilitates communication between electric vehicle (EV) charging stations and central management systems.

Power BI is a business intelligence software created by Microsoft, and it's an essential part of the Microsoft Power Platform. This tool specializes in data visualization, utilizing software services, apps, and connectors to convert disparate and unrelated data sources into coherent, visually rich, and interactive insights.

In the bustling world of transportation and logistics, did you know that the global fleet management market is expected to reach a staggering $34 billion by 2025?
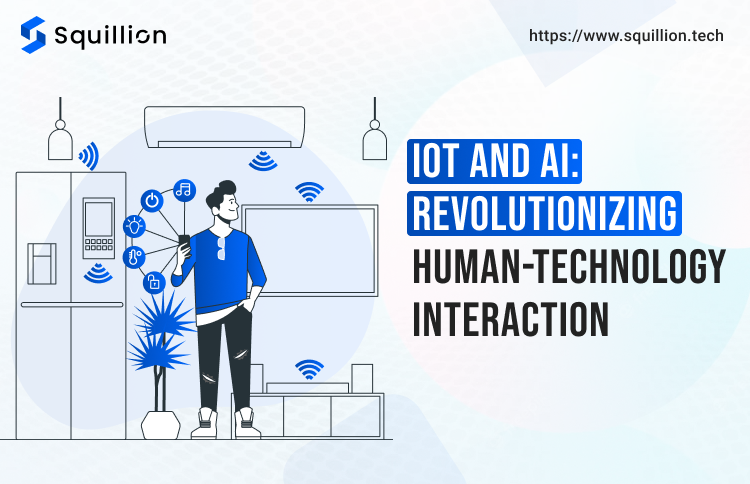
Imagine a world where your refrigerator restocks itself, your car predicts traffic jams before they happen, and your home adjusts its temperature based on your preferences, all without your explicit commands.

